Who am I?
- Senior Software Engineer at Google
- Data Pipelining Efficiency and Infrastructure (MapReduce and more)
- In the past Core Search Engine at Yandex
- ClickHouse infra and efficiency
- C++ library and compiler contributor
- C++ teacher in universities
There is a rumor going on...
- You should trust your compiler
- Compilers are smart
- Don't overoptimize
- C++ is fast
People don't understand how compiler works after thousands hours of practicing
static constexpr auto foo() noexcept -> auto&&
We prioritize freedom
- No centralized build system or a compiler
People choose C++ to control
But they have no idea of the compiler internals

- Speed
- Expressiveness
- History
- Knowledge
- Hiring
- Library Ecosystem
- Tooling
- Put your reason here
Compiler level
- Speed
- Tooling
Compilers
 And others
Focusing more on Clang/LLVM. Most points are available for GCC also
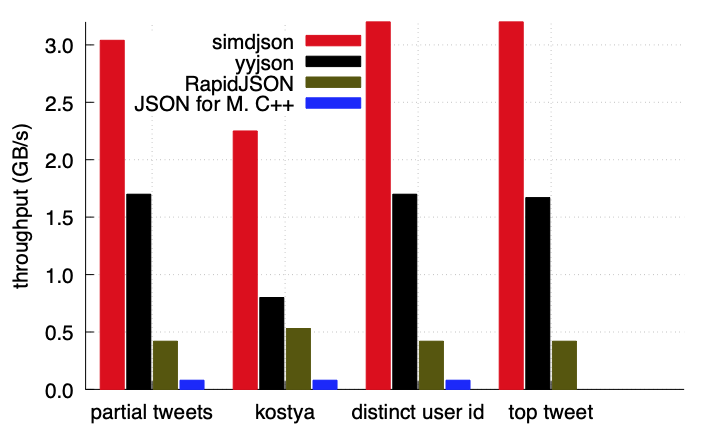 Same C++, same set of inputs, same compilers
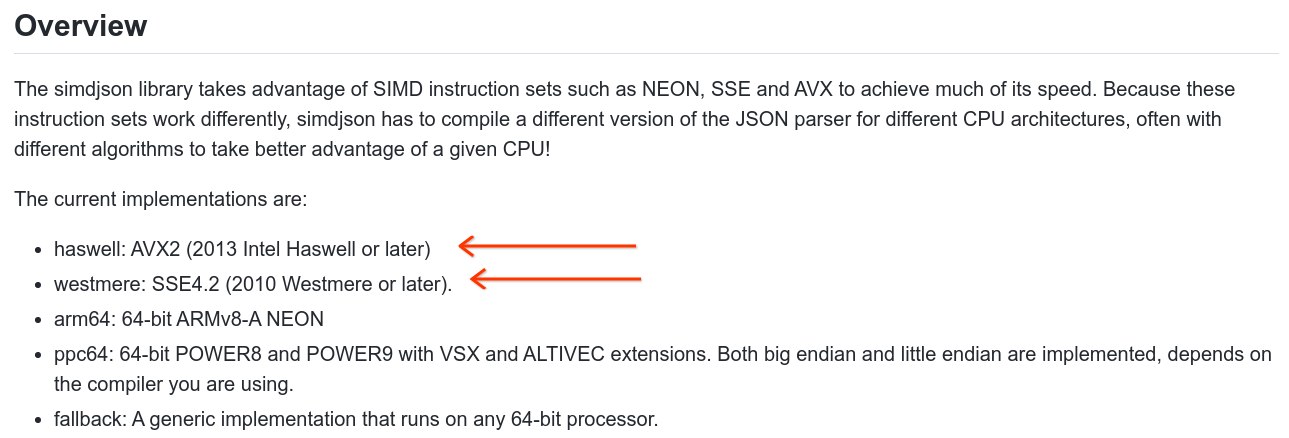
Source: simdjson
What happened?
Well, that's complicated
Forgotten story 1: visibility
// library.h
void Foo();
void Bar();
// library.cc
void Foo() { ... }
void Bar() { ... }
// main.cc
#include "library.h"
Foo();
Bar();
\[ \Longrightarrow \textrm{ ?} \]
// compiled.o
call _Z3Bar
call _Z3Foo
// main.cc
#include "library.h"
Foo();
Bar();
\[ \Longrightarrow \textrm{ No*} \]
// compiled.o
call _Z3Bar
call _Z3Foo
								void Foo() {
									LOG(INFO) << ...
								}
								void Bar() {
									LOG(INFO) << ...
								}
Solution: write in headers!
Well... Please, don't write everything in headers// library.h
// Don't do that often
inline void Foo() {
}
// Don't do that often
inline void Bar() {
}But we lose performance!
Productivity is important also
- LTO sees all program
- ThinLTO provides summaries of modules (sees all potential optimization parts of the program)
- -flto, -flto=thin (only in LLVM)
- 0-10% performance, at Google we saw 3-4%
(Possible) Workflow
- Usual builds without ThinLTO
- Release builds with ThinLTO
- Gains and no blow up in compile times
- Usual LTO may be unscalable

-flto did not finish
Caveats
You don't test what you really build
At Google no problems seen for thousands of targets
Extensive sanitizer usage helps
Integration testing helps
What do they exactly mean?
Let's discuss first some high level architectural overview of compilers


- Front end: parse semantics of C++ into first IR
- Middle end: optimizations over IR
- Back end: codegen for the architecture
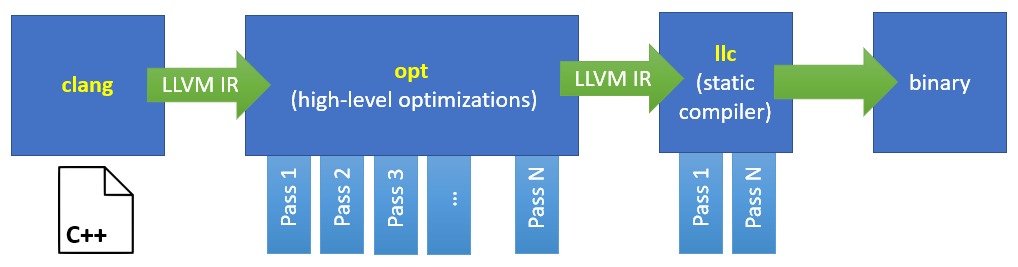
Clang+LLVM
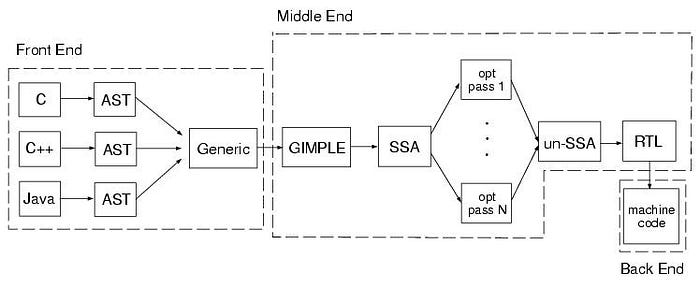
GCC
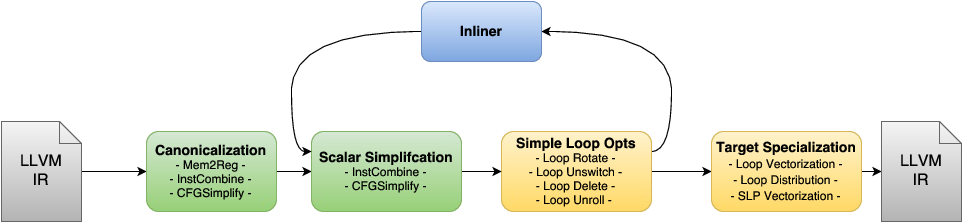
- Middle end: optimizations over IR
- Cleanup and canonicalization
- Simplification and more canonicalization
- Target-specific optimizations and lowering
/* -O3 optimizations.  */
{ OPT_LEVELS_3_PLUS, OPT_fgcse_after_reload, NULL, 1 },
{ OPT_LEVELS_3_PLUS, OPT_fipa_cp_clone, NULL, 1 },
{ OPT_LEVELS_3_PLUS, OPT_floop_interchange, NULL, 1 },
{ OPT_LEVELS_3_PLUS, OPT_floop_unroll_and_jam, NULL, 1 },
{ OPT_LEVELS_3_PLUS, OPT_fpeel_loops, NULL, 1 },
{ OPT_LEVELS_3_PLUS, OPT_fpredictive_commoning, NULL, 1 },
{ OPT_LEVELS_3_PLUS, OPT_fsplit_loops, NULL, 1 },
{ OPT_LEVELS_3_PLUS, OPT_fsplit_paths, NULL, 1 },
{ OPT_LEVELS_3_PLUS, OPT_ftree_loop_distribution, NULL, 1 },
{ OPT_LEVELS_3_PLUS, OPT_ftree_loop_vectorize, NULL, 1 },
{ OPT_LEVELS_3_PLUS, OPT_ftree_partial_pre, NULL, 1 },
{ OPT_LEVELS_3_PLUS, OPT_ftree_slp_vectorize, NULL, 1 },
{ OPT_LEVELS_3_PLUS, OPT_funswitch_loops, NULL, 1 },
{ OPT_LEVELS_3_PLUS, OPT_fvect_cost_model_, NULL, VECT_COST_MODEL_DYNAMIC },
{ OPT_LEVELS_3_PLUS, OPT_fversion_loops_for_strides, NULL, 1 },
/* -ffast-math */
if (!opts->frontend_set_flag_unsafe_math_optimizations) {
opts->x_flag_unsafe_math_optimizations = set;
set_unsafe_math_optimizations_flags (opts, set);
}
if (!opts->frontend_set_flag_finite_math_only)
opts->x_flag_finite_math_only = set;
if (!opts->frontend_set_flag_errno_math)
opts->x_flag_errno_math = !set;
if (Level == OptimizationLevel::O3)
  FPM.addPass(AggressiveInstCombinePass());
// FIXME: It isn't at all clear why this should
// be limited to O3.
if (Level == OptimizationLevel::O3)
  MainCGPipeline.addPass(ArgumentPromotionPass());
if (Level == OptimizationLevel::O3)
  EarlyFPM.addPass(CallSiteSplittingPass());

LPM.addPass(SimpleLoopUnswitchPass(/* NonTrivial */ Level ==
OptimizationLevel::O3));Problem: -O0 is too slow for debugging!
- -O1
- -fno-omit-frame-pointer
- -fno-optimize-sibling-calls
Problem: -O0 is too slow for debugging!
- -O1
- Some optimizations
- -fno-omit-frame-pointer
- Better stacktraces (saves the base pointer)
- -fno-optimize-sibling-calls
- Removes tail call elimination (debuggers are less confused)
Source: LLVM better sanitizer debugging
-Og. Optimize debugging experience
Works nicely only in GCC
Source: GCC optimize Options
Request from a friend:
Hey, buddy! We have likely a compiler bug. We move function out of anonymous namespace and it works. Also works in debug mode.
My response:
No problem, you can bisect optimizations https://llvm.org/docs/OptBisect.html
-mllvm -opt-bisect-limit=N
I don't know of any infra for this in GCCFriend:
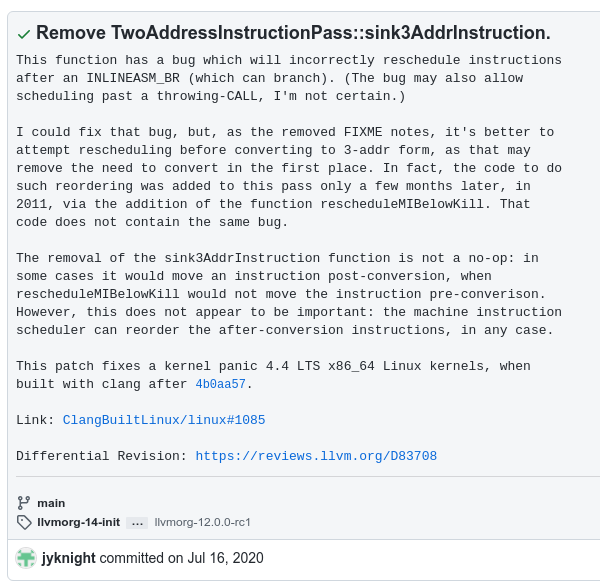
BISECT: running pass (35481) Two-Address instruction pass on function (_ZN3NYT7NDetail10TBindStateILb1EZNS0_11ApplyHelperIN12_GLOBAL__N_111TFirstClassEiFS4_RKNS_8TErrorOrIiEEEEENS_7TFutureIT_EENS_11TFutureBaseIT0_EENS_9TCallbackIT1_EEEUlS8_E_NS_4NMpl9TSequenceIJEEEJEE3RunIJS8_EEEDaPNS0_14TBindStateBaseEDpOT_)
It really was a bug 😳
Request from a friend:
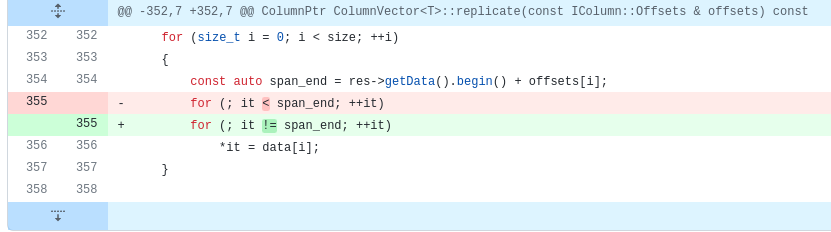
I change < to != and get +30% loop performance!
-Rpass-missed=loop-vectorize
-Rpass=loop-vectorize
-Rpass-analysis=loop-vectorize
LLVM Vectorizing debug https://llvm.org/docs/Vectorizers.html
// example.cpp:44:9: remark: loop not vectorized:
// could not determine number of loop iterations
// [-Rpass-analysis=loop-vectorize]
for (; it < span_end; ++it)
^
 https://github.com/ClickHouse/ClickHouse/pull/9498
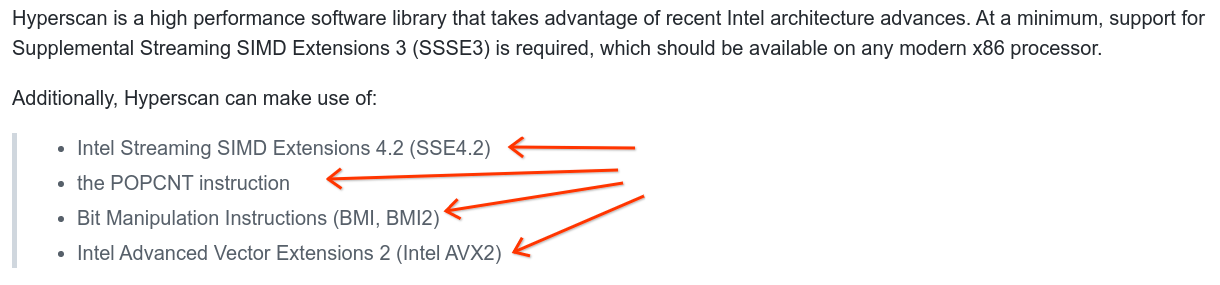
Forgotten story 2: Microarchitecture
- Hardware evolves
- New instruction sets are added
- Caches and cachelines grow

Note: it depends on your hardware
x86. Westmere era (2010)
- -msse2, -msse3, -mssse3, -msse4.1, -msse4.2
- -mpclmul
- -maes
- -mcx16
- -mpopcnt
x86. Westmere era (2010)
- -msse2, -msse3, -mssse3, -msse4.1, -msse4.2
- SSE instruction sets (16 byte registers)
- -mpclmul
- Carry less multiplication (benefitial for CRC and Erasure codes)
- -maes
- Advanced Encryption Set
- -mcx16
- Lock free 16 byte atomics
- -mpopcnt
- Popcount instruction
x86. Haswell era (2013)
- -mavx, -mavx2
- -mbmi2
- -mfma
x86. Haswell era (2013)
- -mavx, -mavx2
- Wider 32 byte registers
- -mbmi2
- Bit manipulation
- -mfma
- Multiply-addition, a += b * c
x86. Why not just AVX/AVX2/AVX512 by default?
- It depends on your hardware and workload
- Share AVX with non AVX -> CPU downclocking
- Heavy AVX (floating point) -> CPU downclocking
- All before including Skylake
- From Ice Lake it becomes better


Forgotten story 3: Function inlining
const int OptSizeThreshold = 50;
const int OptMinSizeThreshold = 5;
const int OptAggressiveThreshold = 250;
const int InstrCost = 5;
const int IndirectCallThreshold = 100;
const int LoopPenalty = 25;
const int LastCallToStaticBonus = 15000;
const int ColdccPenalty = 2000;
const unsigned TotalAllocaSizeRecursiveCaller = 1024;
const uint64_t MaxSimplifiedDynamicAllocaToInline = 65536;- Inlining increases your build size
- And compile time
Bad version:
00000000004004fd <_ZL3addRKiS0_.isra.0>:
  4004fd:       8d 04 37                lea    eax,[rdi+rsi*1]
  400500:       c3
00000000004004fa <_ZL3addRKiS0_.isra.0>:
  4004fa:       8d 04 37                lea    eax,[rdi+rsi*1]
  4004fd:       c3                      ret

[...]

  40051a:       e8 db ff ff ff          call   4004fa <_ZL3addRKiS0_.isra.0>
Standard library
Main differences:
- Small string optimization size
- Vector/string resizing policy
- Additional options
#if defined(_LIBCPP_ABI_UNSTABLE) || _LIBCPP_ABI_VERSION >= 2
// Re-worked external template instantiations for std::string with a focus on
// performance and fast-path inlining.
#define _LIBCPP_ABI_STRING_OPTIMIZED_EXTERNAL_INSTANTIATION
// Enable clang::trivial_abi on std::unique_ptr.
#define _LIBCPP_ABI_ENABLE_UNIQUE_PTR_TRIVIAL_ABI
// Enable clang::trivial_abi on std::shared_ptr and std::weak_ptr
#define _LIBCPP_ABI_ENABLE_SHARED_PTR_TRIVIAL_ABI Source: ClickHouse
This means that, unlike unsigned char, it cannot be used for the underlying storage of objects of another type, nor can it be used to examine the underlying representation of objects of other types; in other words, it cannot be used to alias other typesSource
Summary:
- Visibility
- Optimization Passes
- Microarchitecture
- Standard Library
- Inlining
Many more
- Profile guided optimization
- Post link optimization (BOLT/Propeller)
- New pass manager (default in clang-13)
- Tooling: clang-tidy, AST matchers
Many more
- Profile guided optimization
- Collect profiles and have better loop/inline decisions: LLVM PGO
- Post link optimization (BOLT/Propeller)
- Move blocks together without recompilation
- New pass manager (default in clang-13)
- Better pass manager strategy (mostly inlining)
- Tooling: clang-tidy, AST matchers
- Static analysis
Results
Mozilla Firefox 
- Move from GCC/MSVC to Clang
- -flto, PGO
- -fexperimental-new-pass-manager (by default in clang-13)
5-7% win on Talos tests
Update: As there’s been some interest on reddit and HN, and I failed to mention it originally, it’s worth noting that comparing GCC+PGO vs. clang+LTO or GCC+PGO vs. clang+PGO was a win for clang overall in both cases, although GCC was winning on a few benchmarks. If I remember correctly, clang without PGO/LTO was also winning against GCC without PGO.
Stockfish ![]()
- -flto
- -fexperimental-new-pass-manager (by default in clang-13)
- Options up to AVX512
- Parity performance with GCC
3% win or around 20 Elo points
Yandex Search Engine ![]()
- -msse4.2
- -flto=thin
- AVX/FMA dynamic dispatch on hot paths
- libc++
- Moved from GCC to LLVM
- Inline threshold 1000
7% better average query response time
One trading company
- -flto=thin
- -march=haswell
- Inline threshold 1000
4% faster strategy response. Dropped GCC in favor of LLVM
- Transition from GCC to LLVM
- -O3
- -msse4.2
- -flto=thin
- Transition from libstdc++ to libc++
- libc++ unstable ABI
- char8_t
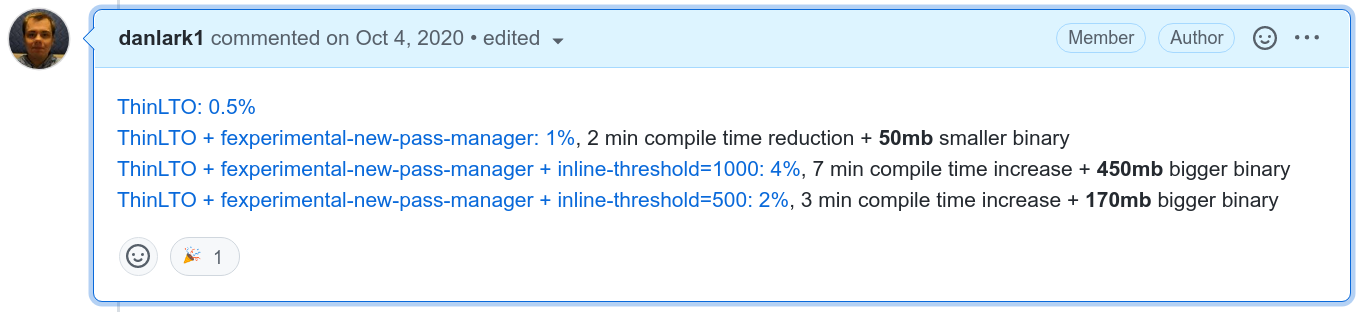
- Function alignment 32
- Inline threshold 1000 (dropped in the end)
7-10% better query response
12% binary size decrease
Google's perspective
- We run all infrastructure built with Clang/LLVM
- We build and compile LLVM from (almost) head
- ThinLTO for release builds, for testing no LTO
- PGO for highly important binaries
- -msse4.2, -march=haswell
- Moved from libstdc++ to libc++
3-5% fleetwide savings
2-2.5% binary size win
- Personal Email: kutdanila@gmail.com
- Work Email: danilak@google.com
- Github: @Danlark1
- Telegram: @Danlark

Thanks to carzil@ for proofreading!